Grafana & Prometheus Monitoring for xCAT-Provisioned Cluster
Environment: Rocky Linux 8.10 · xCAT-Provisioned Cluster · Lab Validation
Stack:node_exporteron all nodes + Prometheus and Grafana on the master
1. Architecture
Where Each Component Runs
| Component | Master | Compute Nodes |
|---|---|---|
node_exporter |
✅ | ✅ |
| Prometheus | ✅ | ❌ |
| Grafana | ✅ | ❌ |
Important: node_exporter runs on every node, including the master and every compute node. It exposes system metrics on port 9100.
Prometheus runs only on the master. It pulls metrics from every node's node_exporter over the network.
Grafana runs only on the master. It queries Prometheus and displays the metrics in a browser.
Do not install Prometheus, create a Prometheus user, or copy
prometheus.ymlto compute nodes. A compute node only needsnode_exporter.
2. Environment Overview
| Field | Value |
|---|---|
| Master node | labtesting.local.com (192.168.245.128) |
| Compute node | cnode01 (192.168.245.10) |
| OS | Rocky Linux 8.10 |
node_exporter |
1.12.1 |
| Prometheus | 3.14.0 |
| Grafana | 13.2.0 |
| Prometheus Web UI / API | http://192.168.245.128:9090 |
| Grafana Web UI | http://192.168.245.128:3000 |
Phase 1 — node_exporter on the Master
Run this phase directly on the master. The master is not provisioned through xCAT postscripts in the same way as compute nodes.
1.1 Create a Dedicated Service User
useradd --no-create-home --shell /sbin/nologin node_exporter
Why This Matters
node_exporter only needs to read /proc and /sys to report metrics. Running it as a dedicated non-login user avoids unnecessary root privileges.
Verify
id node_exporter
The user should exist with no valid login shell.
1.2 Download and Install node_exporter
cd /tmp

wget https://github.com/prometheus/node_exporter/releases/download/v1.12.1/node_exporter-1.12.1.linux-amd64.tar.gz

tar xvfz node_exporter-1.12.1.linux-amd64.tar.gz

cp node_exporter-1.12.1.linux-amd64/node_exporter /usr/local/bin/

chown node_exporter:node_exporter /usr/local/bin/node_exporter
Why This Matters
node_exporter is distributed as a static binary, so it can be installed directly without using the package manager.
Verify
ls -l /usr/local/bin/node_exporter
The binary should be owned by:
node_exporter:node_exporter
Pitfall: chown Input Duplication
During the lab, a chown command was accidentally duplicated/concatenated in the terminal, producing cannot access errors.
This was a terminal input/paste issue rather than an installation problem.
If this happens, retype the clean command:
chown node_exporter:node_exporter /usr/local/bin/node_exporter
1.3 Create the systemd Service
cat > /etc/systemd/system/node_exporter.service << 'EOF'
[Unit]
Description=Node Exporter
After=network-online.target

[Service]
User=node_exporter
Group=node_exporter
Type=simple
ExecStart=/usr/local/bin/node_exporter

[Install]
WantedBy=multi-user.target
EOF
Start and enable the service:
systemctl daemon-reload
systemctl enable --now node_exporter
Verify
systemctl status node_exporter
The service should show:
active (running)
Test the metrics endpoint:
curl -s http://localhost:9100/metrics | head -5
Real Prometheus metrics should be returned.

Phase 2 — node_exporter on Compute Nodes
This is the only monitoring component installed on compute nodes.
2.1 Create the xCAT Postscript
Create:
cat > /install/postscripts/setup_node_exporter << 'EOF'
#!/bin/bash

useradd --no-create-home --shell /sbin/nologin node_exporter 2>/dev/null

cd /tmp

curl -sL -o node_exporter.tar.gz \
https://github.com/prometheus/node_exporter/releases/download/v1.12.1/node_exporter-1.12.1.linux-amd64.tar.gz

tar xzf node_exporter.tar.gz

cp node_exporter-1.12.1.linux-amd64/node_exporter /usr/local/bin/

chown node_exporter:node_exporter /usr/local/bin/node_exporter

cat > /etc/systemd/system/node_exporter.service << 'SVC'
[Unit]
Description=Node Exporter
After=network-online.target

[Service]
User=node_exporter
Group=node_exporter
Type=simple
ExecStart=/usr/local/bin/node_exporter

[Install]
WantedBy=multi-user.target
SVC

systemctl daemon-reload
systemctl enable --now node_exporter

echo "node_exporter installed and running"
EOF
Make it executable:
chmod +x /install/postscripts/setup_node_exporter
Critical Verification
Immediately check the first line:
head -1 /install/postscripts/setup_node_exporter
It must print exactly:
#!/bin/bash
Pitfall: Text Accidentally Added Above the Shebang
During the lab, the postscript initially failed with:
./setup_node_exporter: line 1: The: command not found
The cause was an explanatory sentence accidentally pasted above the #!/bin/bash line.
Always verify the first line before running the postscript against nodes.
2.2 Push to the Compute Group
Assign the postscript:
chdef compute -p postscripts=setup_node_exporter
Push it:
updatenode compute -P setup_node_exporter
Verify
xdsh compute "curl -s http://localhost:9100/metrics | head -5"
Each compute node should return real metrics.

Phase 3 — Prometheus Server
MASTER ONLY — do not run these commands on compute nodes.
3.1 Create the Prometheus User and Directories
useradd --no-create-home --shell /sbin/nologin prometheus

mkdir -p /etc/prometheus /var/lib/prometheus
3.2 Download and Install Prometheus
cd /tmp

wget https://github.com/prometheus/prometheus/releases/download/v3.14.0/prometheus-3.14.0.linux-amd64.tar.gz

tar xvfz prometheus-3.14.0.linux-amd64.tar.gz

cd prometheus-3.14.0.linux-amd64

cp prometheus promtool /usr/local/bin/
Prometheus 3.x Console Directory Note
Older Prometheus installation guides may contain:
cp -r consoles console_libraries /etc/prometheus/
For the Prometheus 3.x release used in this lab, those directories are not included in the release tarball.
Therefore, do not run that copy command.
Also, do not add the old:
--web.console.templates
--web.console.libraries
options to the Prometheus 3.x service.
Verify
ls /tmp/prometheus-3.14.0.linux-amd64/
The release should contain the Prometheus binaries and configuration files without the old consoles/ and console_libraries/ directories.
3.3 Set Ownership
chown -R prometheus:prometheus \
/etc/prometheus \
/var/lib/prometheus \
/usr/local/bin/prometheus \
/usr/local/bin/promtool
3.4 Configure Prometheus Scrape Targets
Create the configuration:
cat > /etc/prometheus/prometheus.yml << 'EOF'
global:
  scrape_interval: 15s

scrape_configs:
  - job_name: 'node_exporter'
    static_configs:
      - targets:
          - '192.168.245.128:9100'
          - '192.168.245.10:9100'
EOF
Set ownership:
chown prometheus:prometheus /etc/prometheus/prometheus.yml
Why This Matters
Both IP addresses are node_exporter endpoints:
192.168.245.128:9100— master192.168.245.10:9100—cnode01
Prometheus reaches out to these endpoints. Nothing needs to be copied to the compute node.
Verify
cat /etc/prometheus/prometheus.yml
3.5 Create the Prometheus systemd Service
cat > /etc/systemd/system/prometheus.service << 'EOF'
[Unit]
Description=Prometheus
Wants=network-online.target
After=network-online.target

[Service]
User=prometheus
ExecStart=/usr/local/bin/prometheus \
  --config.file=/etc/prometheus/prometheus.yml \
  --storage.tsdb.path=/var/lib/prometheus/

[Install]
WantedBy=multi-user.target
EOF
Start the service:
systemctl daemon-reload
systemctl enable --now prometheus
Verify
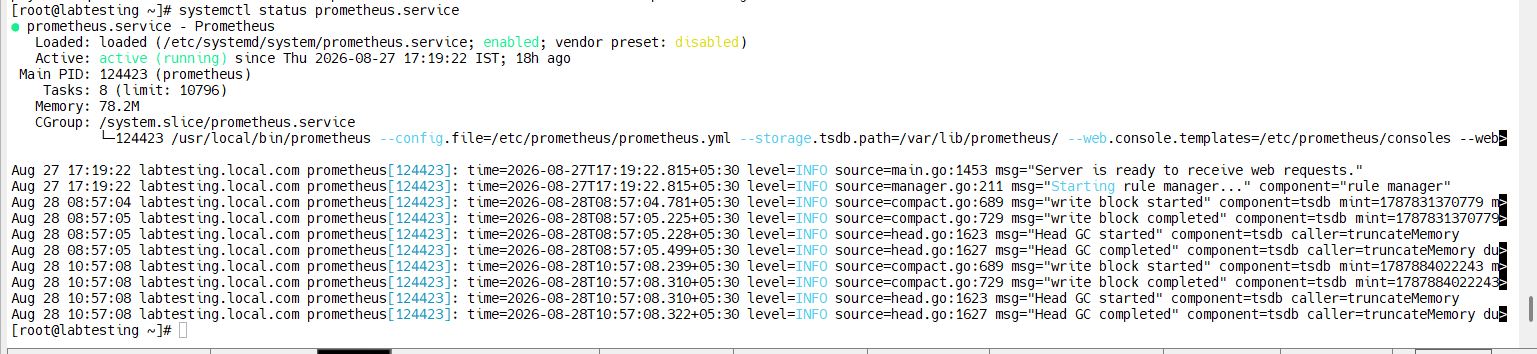
systemctl status prometheus
It should show:
active (running)
There should be no errors about missing console directories.
3.6 Confirm Both Targets Are Being Scraped
Run on the master:
curl -s http://localhost:9090/api/v1/targets | \
python3 -m json.tool | grep -E "instance|health"
Expected Result
Both targets should report:
"health": "up"
Expected instances:
192.168.245.128:9100
192.168.245.10:9100
This confirms that Prometheus can reach both node_exporter endpoints and successfully scrape metrics.

Phase 4 — Grafana
MASTER ONLY
4.1 Add the Grafana Repository
wget -q -O /tmp/gpg.key https://rpm.grafana.com/gpg.key

rpm --import /tmp/gpg.key

tee /etc/yum.repos.d/grafana.repo << 'EOF'
[grafana]
name=Grafana OSS
baseurl=https://rpm.grafana.com
repo_gpgcheck=1
enabled=1
gpgcheck=1
gpgkey=https://rpm.grafana.com/gpg.key
sslverify=1
sslcacert=/etc/pki/tls/certs/ca-bundle.crt
EOF
4.2 Install and Start Grafana
dnf install -y grafana

systemctl daemon-reload

systemctl enable --now grafana-server
Verify
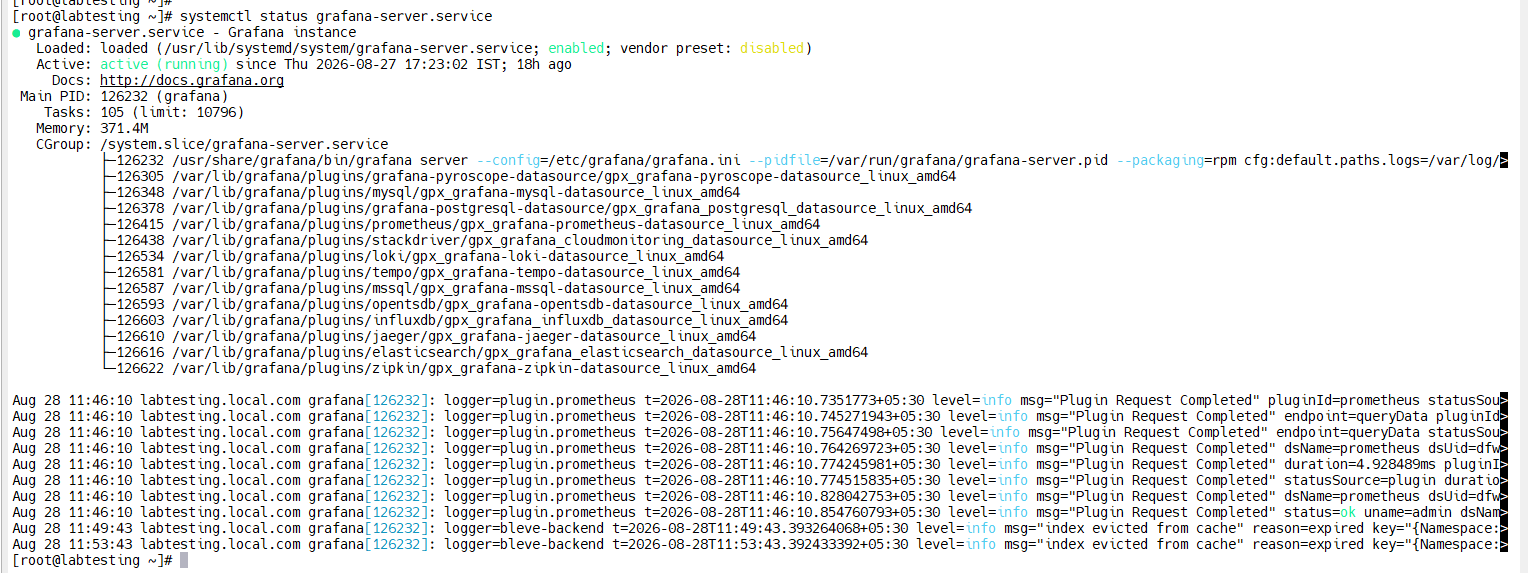
systemctl status grafana-server
The service should show:
active (running)
4.3 Log In and Change the Default Password
Open:
http://192.168.245.128:3000
Default credentials:
Username: admin
Password: admin
On the first login, change the default password.
Verify
After changing the password, the Grafana home screen should load.
4.4 Add Prometheus as a Data Source
In Grafana:
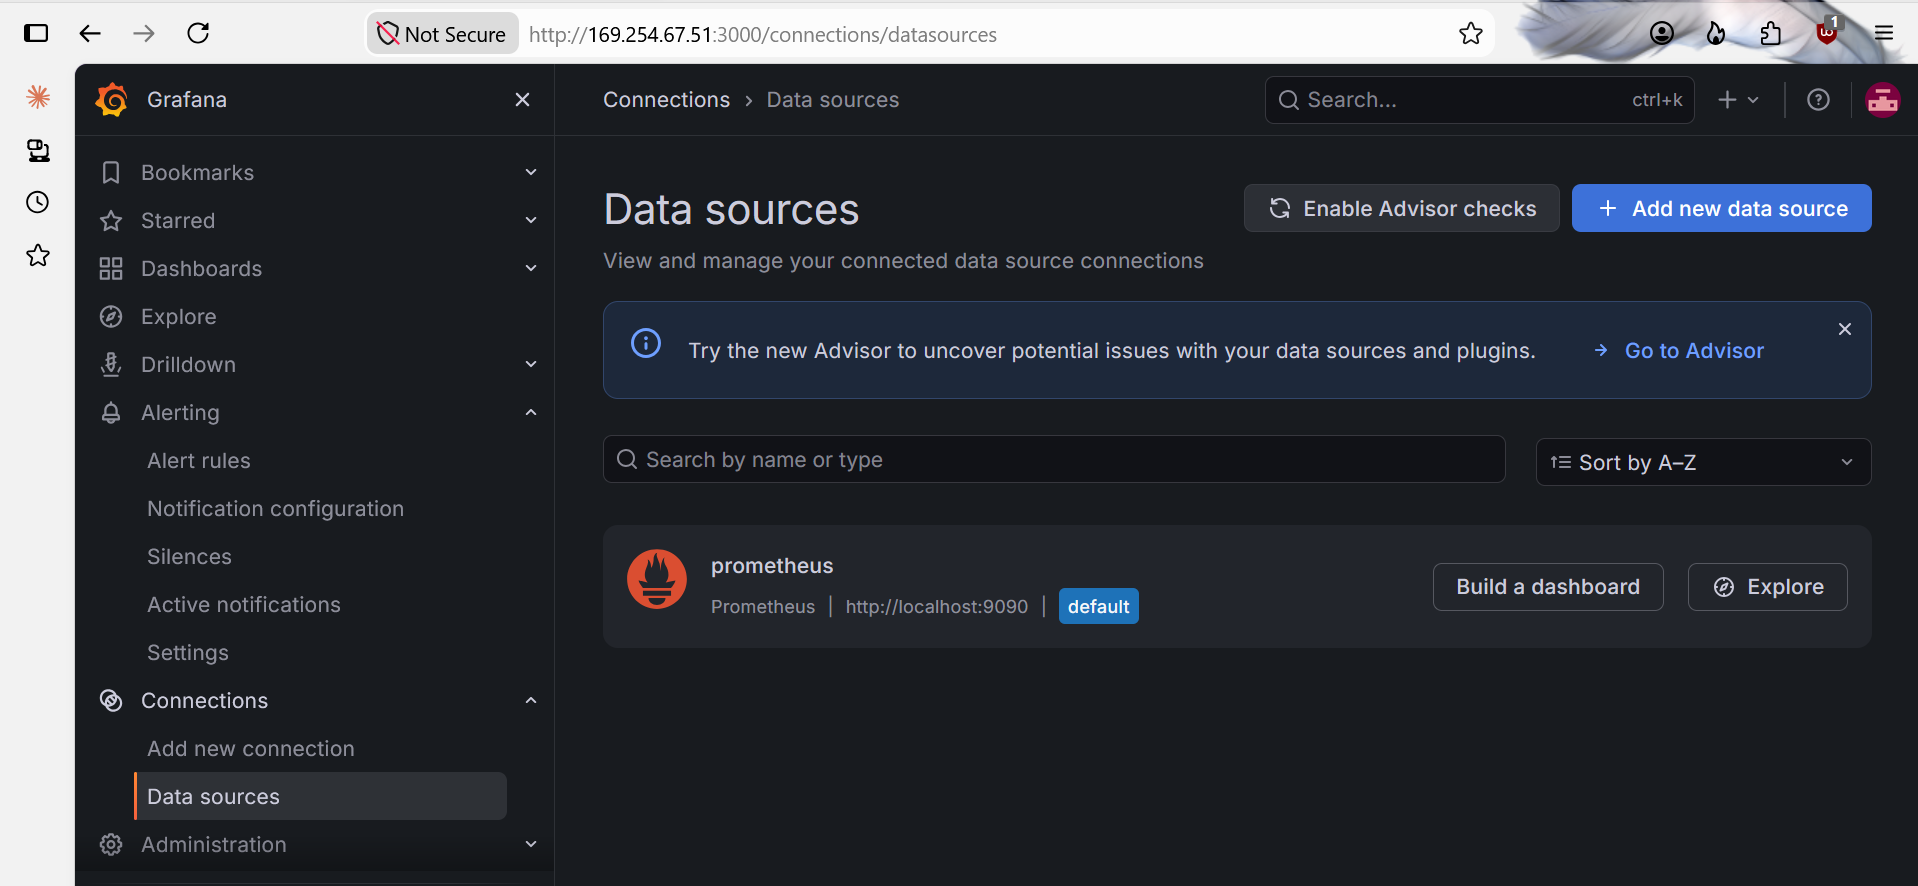
- Open Connections
- Select Data sources
- Select Add data source
- Select Prometheus
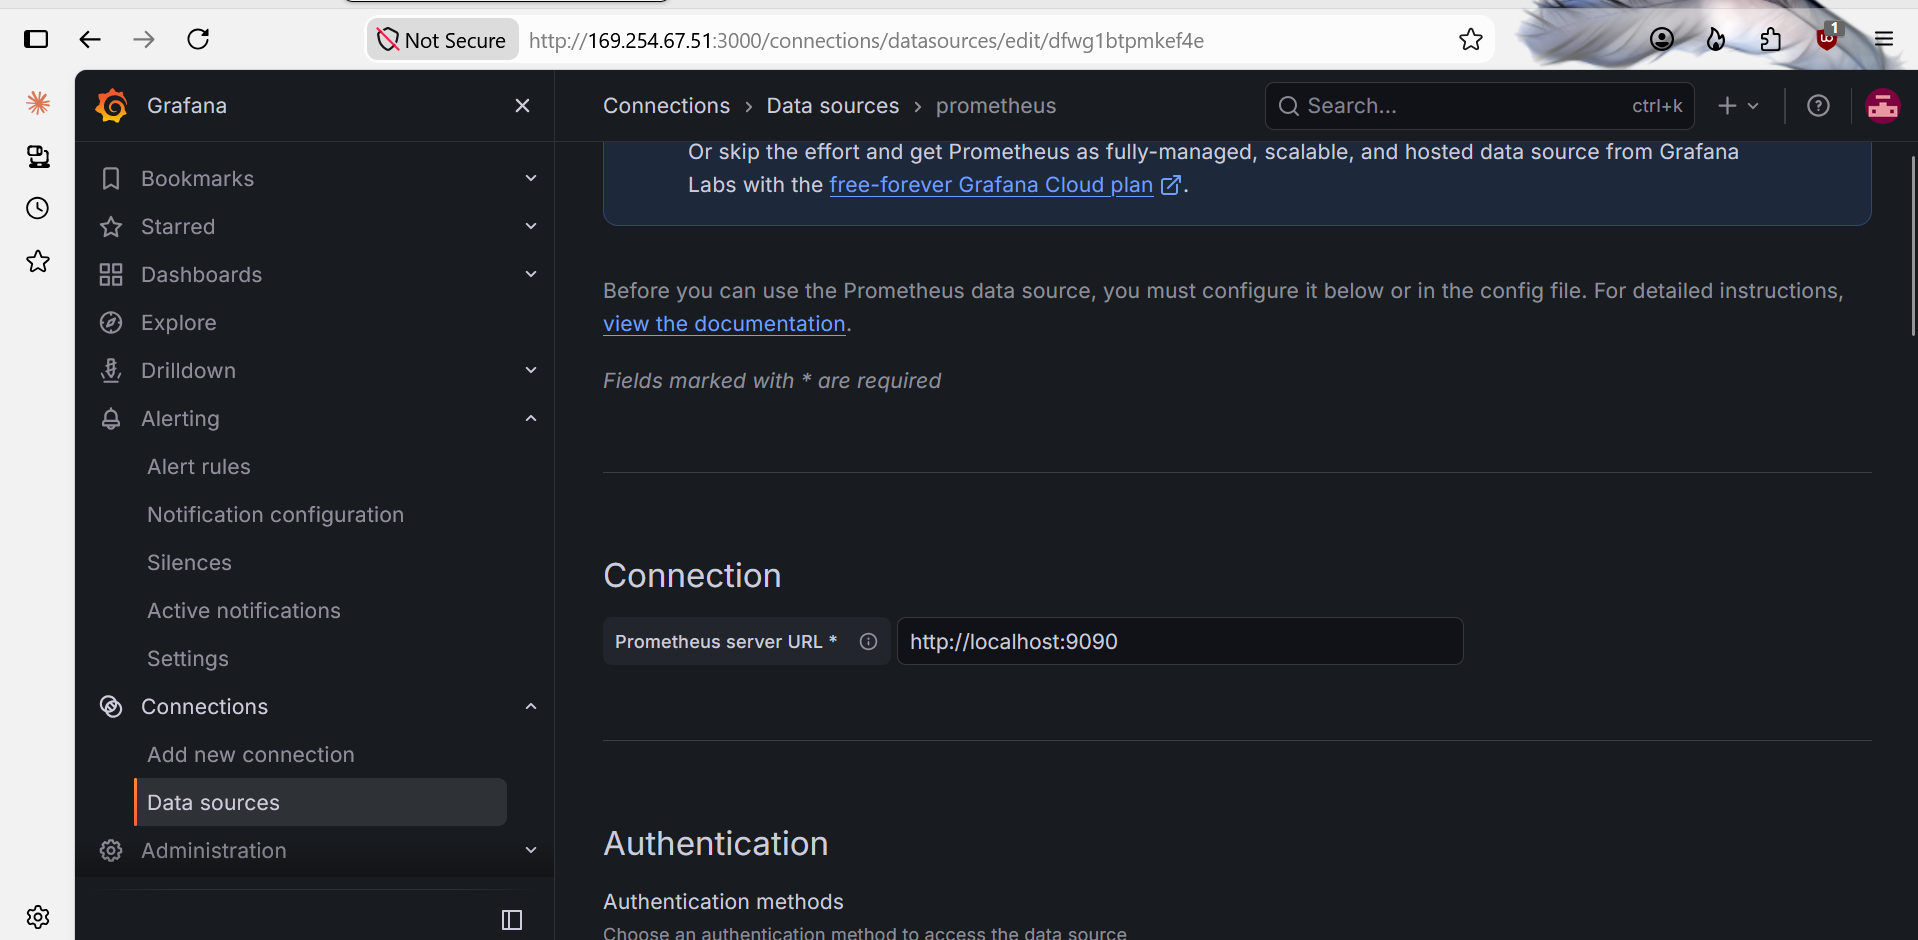
- Set the URL to:
http://localhost:9090
- Click Save & Test
A successful connection should display a green success message.
Why This Matters
Grafana does not store the monitoring metrics in this setup. Grafana queries Prometheus, which stores and provides the metrics.
Phase 5 — Import the Node Exporter Dashboard
5.1 Import Dashboard 1860
In Grafana:
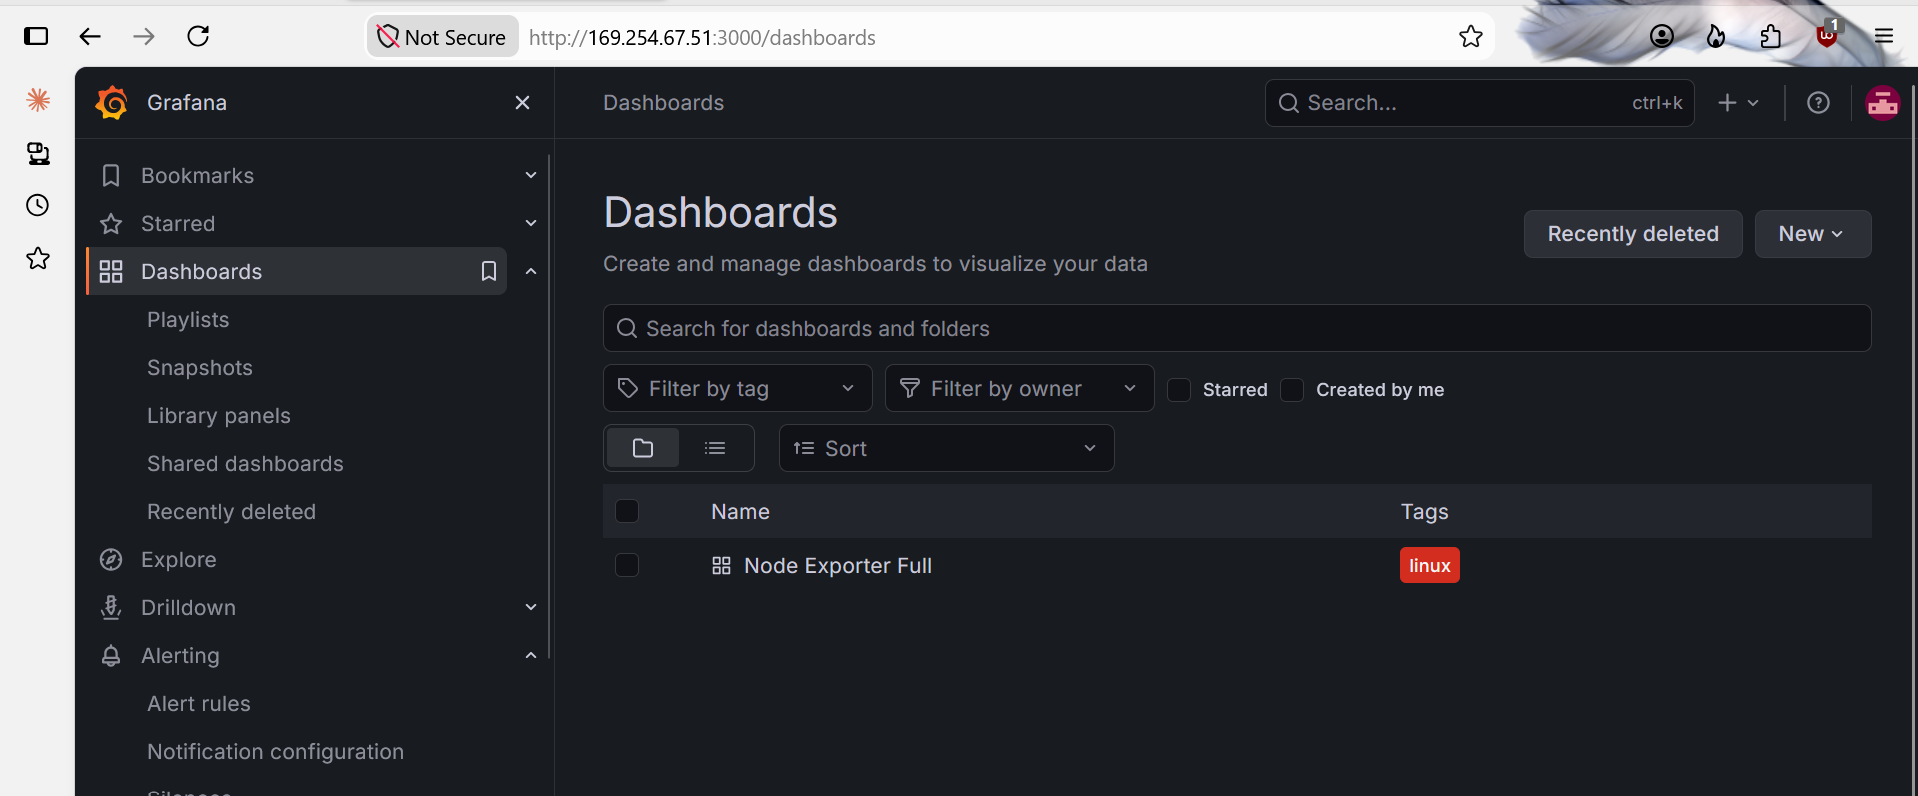
- Open Dashboards
- Select New
- Select Import
- Enter dashboard ID:
1860
- Select the Prometheus data source created above.
- Click Import.
Dashboard 1860 — Node Exporter Full provides commonly used node metrics such as:
- CPU
- Memory
- Disk
- Network
Verify
The dashboard should load with live data.
Use the Nodename dropdown to switch between:
- Master
cnode01
6. Full Verification Checklist
Run the following checks after completing the installation.
Master node_exporter
curl -s http://localhost:9100/metrics | head -5
Expected: real metrics are returned.
Compute node_exporter
xdsh compute "curl -s http://localhost:9100/metrics | head -5"
Expected: real metrics are returned from compute nodes.
Prometheus
systemctl status prometheus
Expected:
active (running)
Prometheus targets
curl -s http://localhost:9090/api/v1/targets
Expected:
192.168.245.128:9100 → health: up
192.168.245.10:9100  → health: up
Grafana
systemctl status grafana-server
Expected:
active (running)
Grafana Dashboard
Dashboard 1860 should display live data for the master and cnode01.
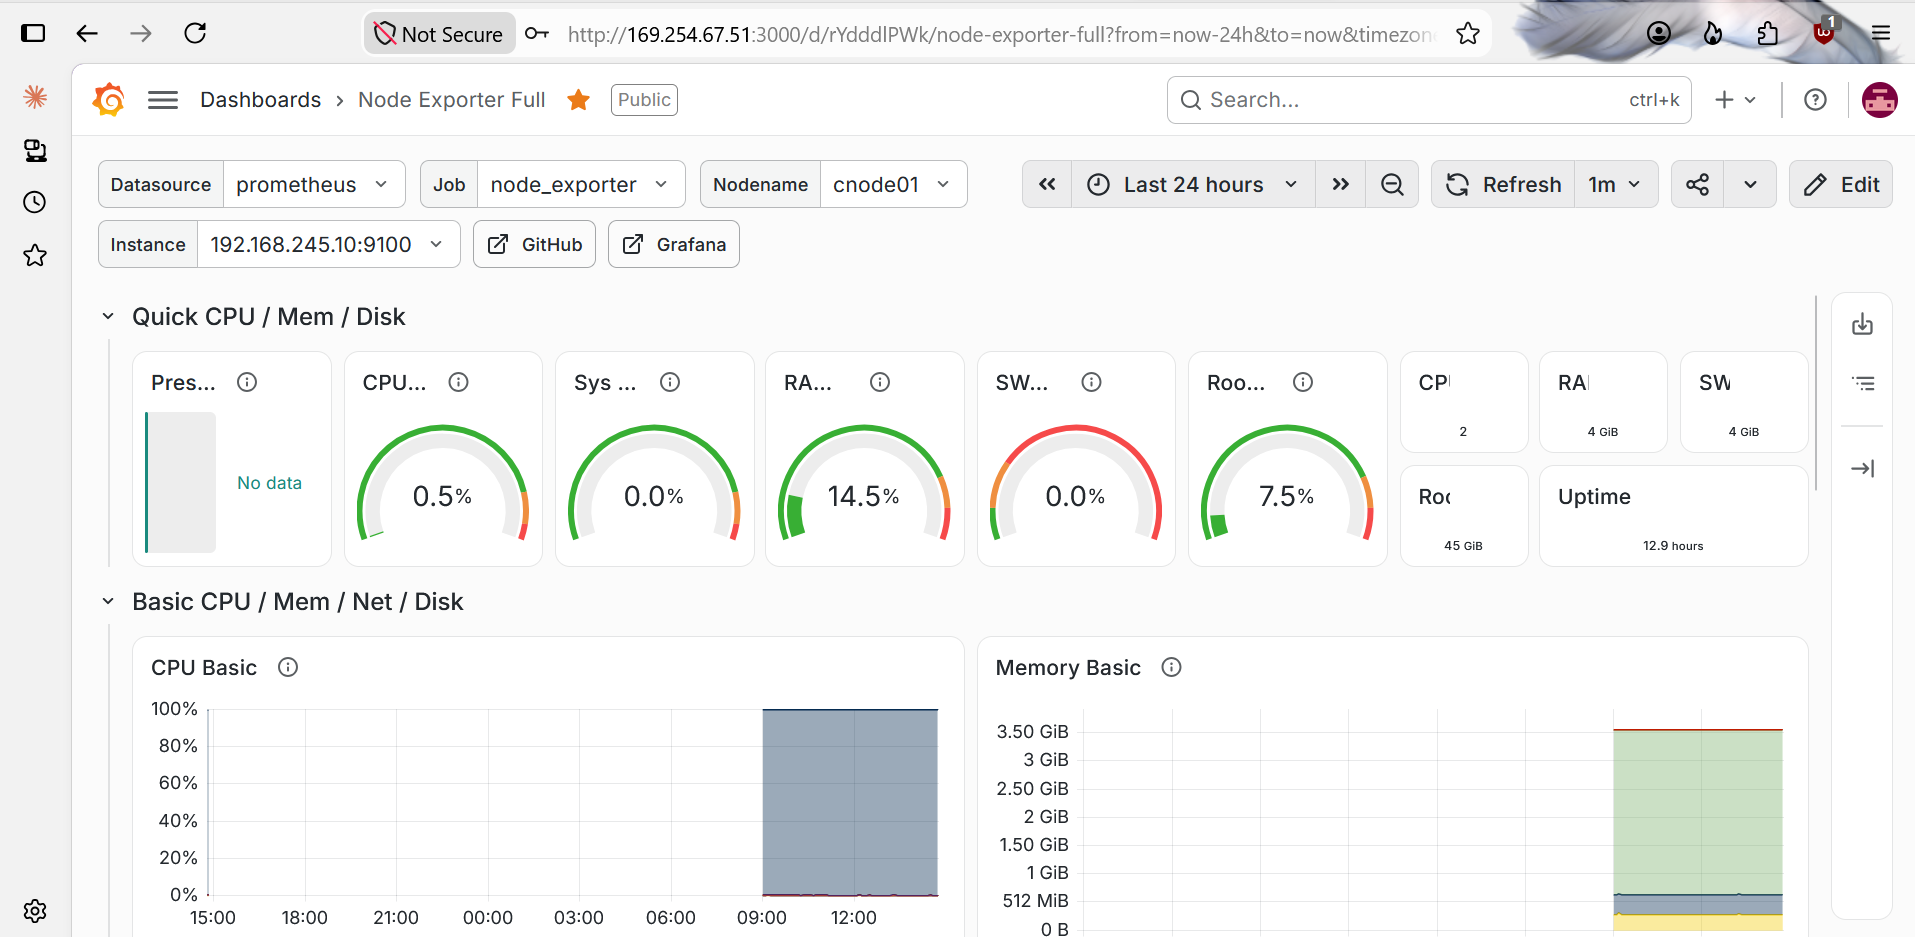
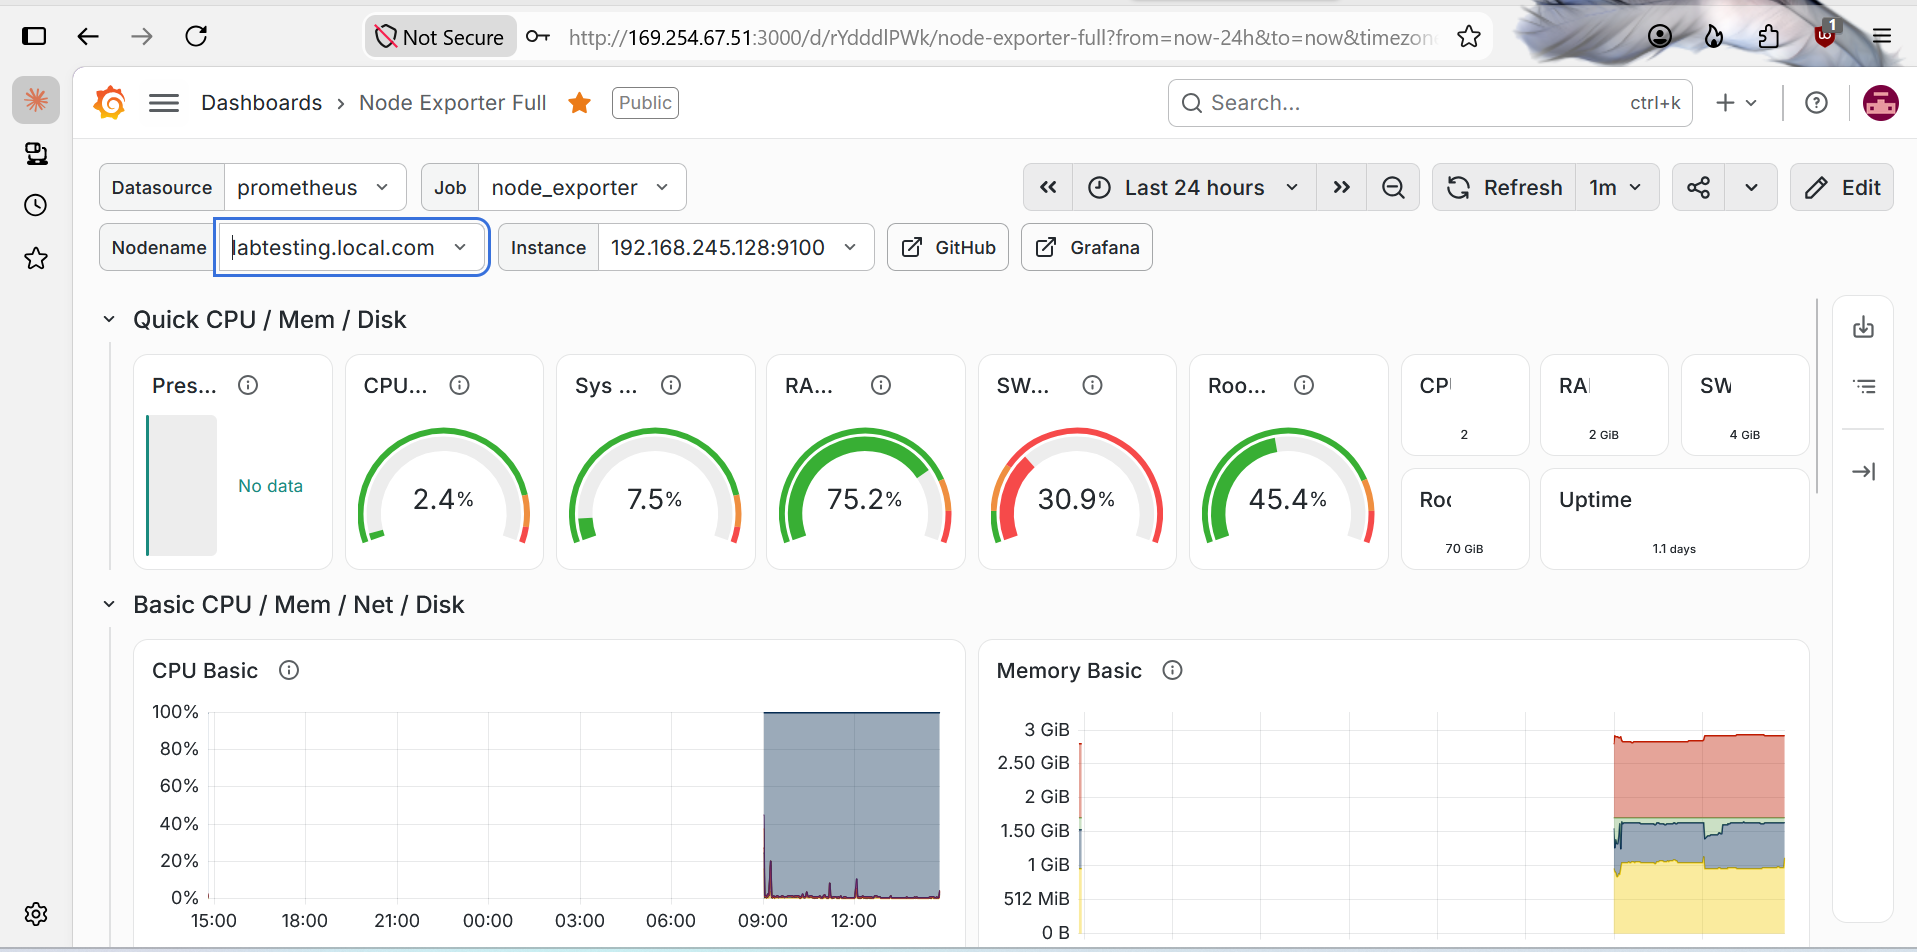
Expected VM behavior: A blank or
No dataCPU temperature/hwmon panel is expected when the guest VM does not expose real hardware thermal sensors.
7. Issue Log and Fixes
| Issue | Cause | Fix |
|---|---|---|
setup_node_exporter: line 1: The: command not found |
Text was accidentally pasted above the #!/bin/bash shebang |
Run head -1 <postscript> and ensure the first line is exactly #!/bin/bash |
chown produced cannot access errors |
Terminal input duplication/mangled command | Retype the clean command and verify it before execution |
cp -r consoles console_libraries /etc/prometheus/ failed |
Prometheus 3.x no longer ships these old console directories | Skip the copy and remove old console flags |
scp prometheus.yml to compute node failed |
Prometheus server does not run on compute nodes | Keep Prometheus configuration on the master only |
prometheus:prometheus user invalid on cnode01 |
Prometheus was incorrectly being configured on the compute node | Do not create a Prometheus user, config, or service on compute nodes |
8. Production Deployment Notes
8.1 Security
The lab configuration uses Grafana over plain HTTP:
http://192.168.245.128:3000
Before production sign-off:
- Confirm the default Grafana password has been changed.
- Enable TLS.
- Consider placing Grafana behind a reverse proxy such as nginx or Apache, or configure Grafana's own TLS support.
8.2 Scaling to More Compute Nodes
The current prometheus.yml uses manually defined targets.
For additional nodes, you can either add their IP:9100 entries manually and reload Prometheus:
curl -X POST http://localhost:9090/-/reload
Or move to file_sd_configs and generate the target file automatically from the xCAT node list.
For example, the target list can be generated from:
nodels compute
8.3 Grafana Backup
Include:
/var/lib/grafana
in your backup routine because it contains Grafana data such as dashboards, data sources, and users.
8.4 Alerting
This guide focuses on dashboards and monitoring visibility.
A useful next step is to configure alerts for:
- Node down
- Disk full
- High CPU load
- High memory usage
- Other cluster health conditions
9. Monitoring Architecture
                         +----------------------+
                         |    Prometheus        |
                         |      MASTER          |
                         |      :9090           |
                         +----------+-----------+
                                    |
                         Scrapes metrics from
                                    |
             +----------------------+----------------------+
             |                                             |
             v                                             v
+--------------------------+                 +--------------------------+
|       Master             |                 |       cnode01            |
|   node_exporter :9100    |                 |   node_exporter :9100    |
+--------------------------+                 +--------------------------+
             ^
             |
             | Queries
             |
+--------------------------+
|        Grafana           |
|         MASTER           |
|         :3000            |
+--------------------------+
Data Flow
Compute/Master node
       |
       | node_exporter :9100
       v
Prometheus :9090
       |
       | PromQL queries
       v
Grafana :3000
       |
       v
Web Browser
10. Quick Command Reference
| Task | Command |
|---|---|
| Check node_exporter | systemctl status node_exporter |
| Test node_exporter | curl -s http://localhost:9100/metrics \| head -5 |
| Create xCAT postscript | vi /install/postscripts/setup_node_exporter |
| Verify postscript shebang | head -1 /install/postscripts/setup_node_exporter |
| Assign postscript | chdef compute -p postscripts=setup_node_exporter |
| Push postscript | updatenode compute -P setup_node_exporter |
| Test all compute nodes | xdsh compute "curl -s http://localhost:9100/metrics \| head -5" |
| Check Prometheus | systemctl status prometheus |
| Check Prometheus targets | curl -s http://localhost:9090/api/v1/targets |
| Check Grafana | systemctl status grafana-server |
| Grafana URL | http://192.168.245.128:3000 |
| Prometheus URL | http://192.168.245.128:9090 |
| Dashboard | 1860 — Node Exporter Full |
11. Final Result
The lab monitoring stack was successfully validated with:
Rocky Linux 8.10
        |
        +---- xCAT
        |
        +---- node_exporter
        |       |
        |       +---- Master
        |       +---- cnode01
        |
        +---- Prometheus 3.14.0
        |       |
        |       +---- Scrapes both node_exporter endpoints
        |
        +---- Grafana 13.2.0
                |
                +---- Prometheus data source
                +---- Dashboard 1860
The validated pipeline is:
xCAT → node_exporter → Prometheus → Grafana → Web Dashboard