SNMP Network Monitoring — Complete Installation Guide
snmp_exporter + net-snmp + Prometheus + Grafana
Rocky Linux 8.10 · Prometheus 3.14.0 · Grafana 13.2.0 · snmp_exporter 0.30.1
1. Architecture
Where each component runs:
snmp_exporterruns on the master only. It polls remote devices over SNMP and translates the results into Prometheus metrics. Prometheus (also master-only) scrapessnmp_exporter, not the monitored device directly — the device being monitored never needs any Prometheus/Grafana component installed on it, only an SNMP agent (snmpd) answering queries.
In this guide, the master node itself is used as the monitored device (via a local net-snmp agent) — a practical stand-in when no separate firewall/router appliance is available in the lab.
2. Environment
| Field | Value |
|---|---|
| Master node | labtesting.local.com (192.168.245.128) |
| snmp_exporter version | 0.30.1 |
| snmp_exporter port | 9116 |
| Monitored device (this guide) | The master itself, via local net-snmp agent on port 161 |
| Prometheus scrape job | snmp, module if_mib |
| Grafana dashboard used | ID 23022 — "SNMP Stats" |
Phase 1 — Install snmp_exporter
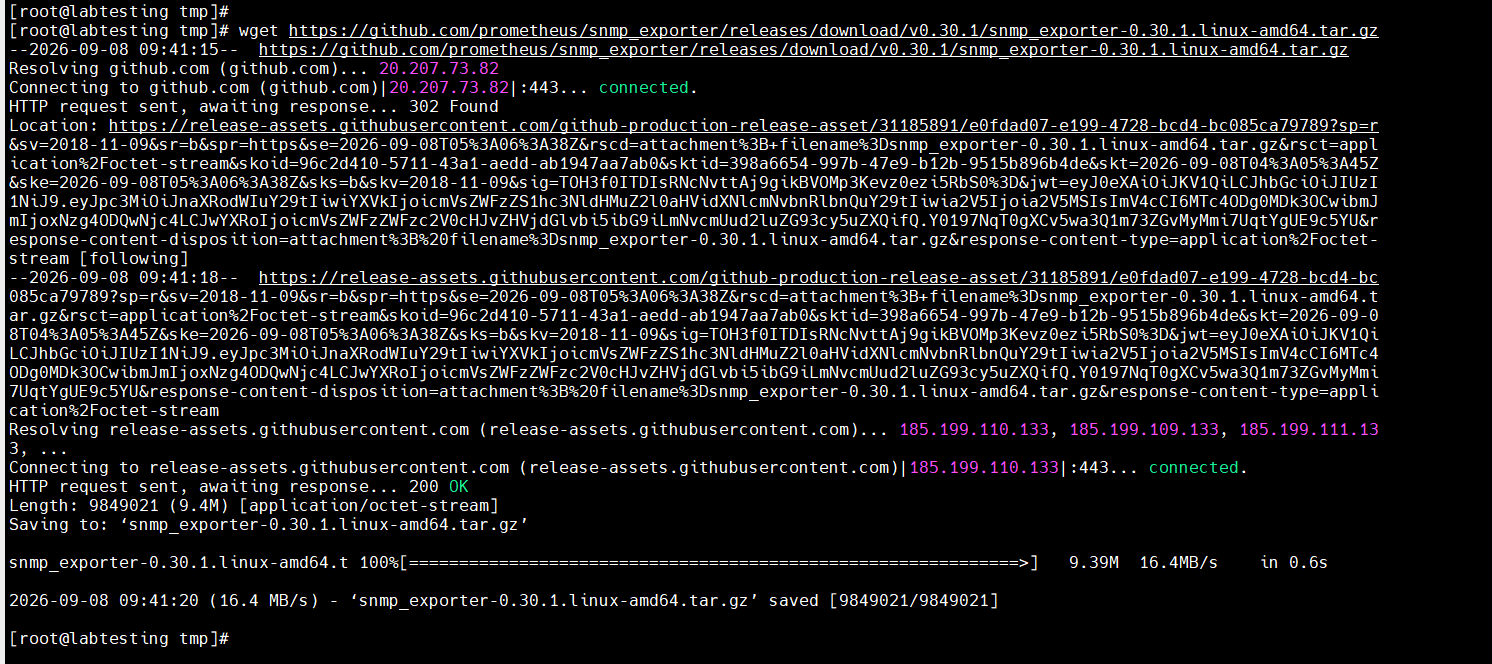
1.1 Download the release
cd /tmp
wget https://github.com/prometheus/snmp_exporter/releases/download/v0.30.1/snmp_exporter-0.30.1.linux-amd64.tar.gz
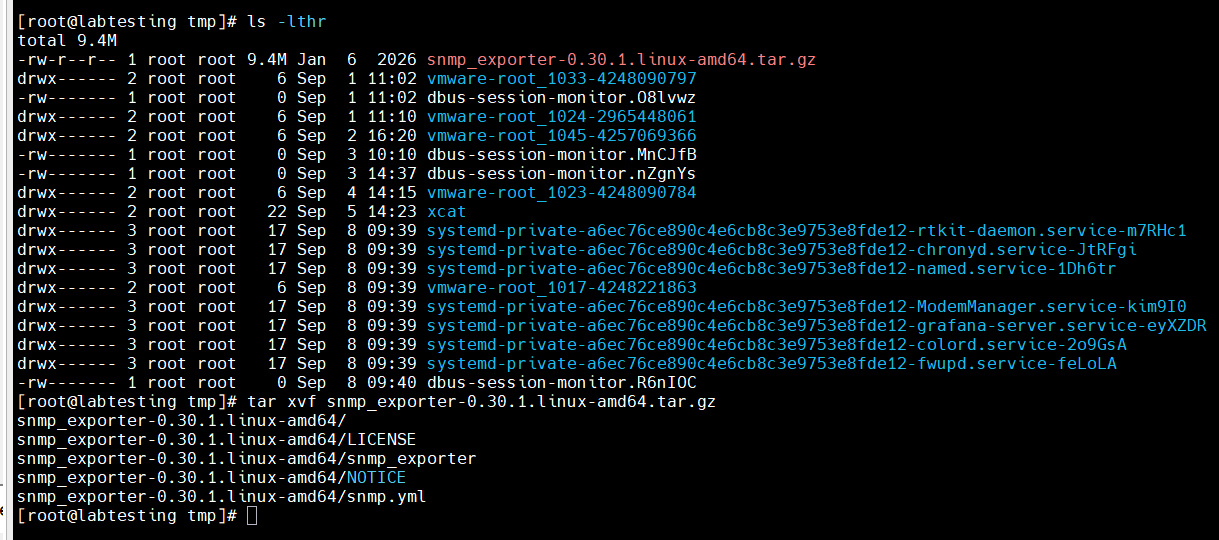
1.2 Extract it
tar xvf snmp_exporter-0.30.1.linux-amd64.tar.gz
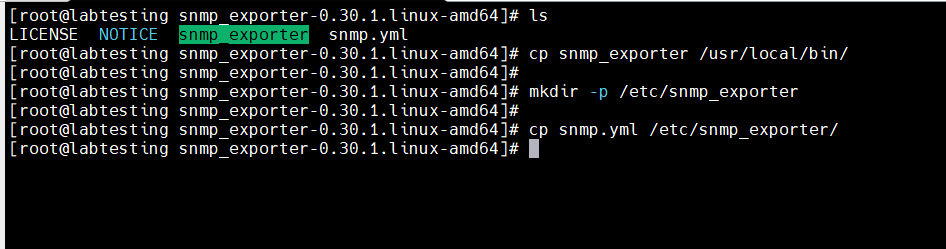
1.3 Install the binary and default config
cd snmp_exporter-0.30.1.linux-amd64
cp snmp_exporter /usr/local/bin/
mkdir -p /etc/snmp_exporter
cp snmp.yml /etc/snmp_exporter/
Why: the bundled
snmp.ymlis pre-generated with thousands of standard OID mappings (via theif_mibmodule) so a working config exists without hand-writing one.
1.4 Create a dedicated service user
useradd --no-create-home --shell /sbin/nologin snmp_exporter
chown snmp_exporter:snmp_exporter /usr/local/bin/snmp_exporter
chown snmp_exporter:snmp_exporter /etc/snmp_exporter/snmp.yml

Phase 2 — systemd Service
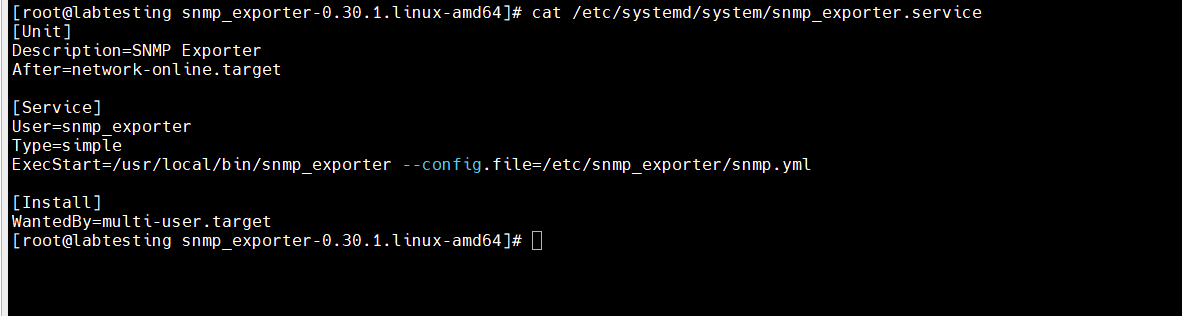
2.1 Create the service file
cat > /etc/systemd/system/snmp_exporter.service << 'EOF'
[Unit]
Description=SNMP Exporter
After=network-online.target

[Service]
User=snmp_exporter
Type=simple
ExecStart=/usr/local/bin/snmp_exporter --config.file=/etc/snmp_exporter/snmp.yml

[Install]
WantedBy=multi-user.target
EOF
2.2 Enable and start it
systemctl daemon-reload
systemctl enable --now snmp_exporter
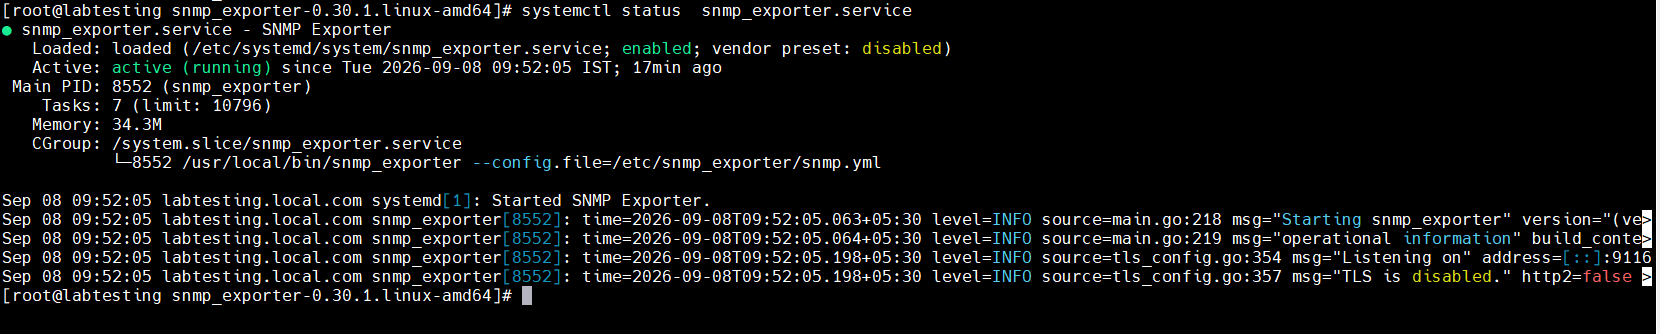
Verify: systemctl status snmp_exporter — must show active (running) and Listening on address=[::]:9116.
Phase 3 — Monitored Device Setup (net-snmp agent)
This phase installs an SNMP agent to be queried. On a real deployment this would already exist on the firewall/router; here it's installed locally on the master as a stand-in.
3.1 Install net-snmp
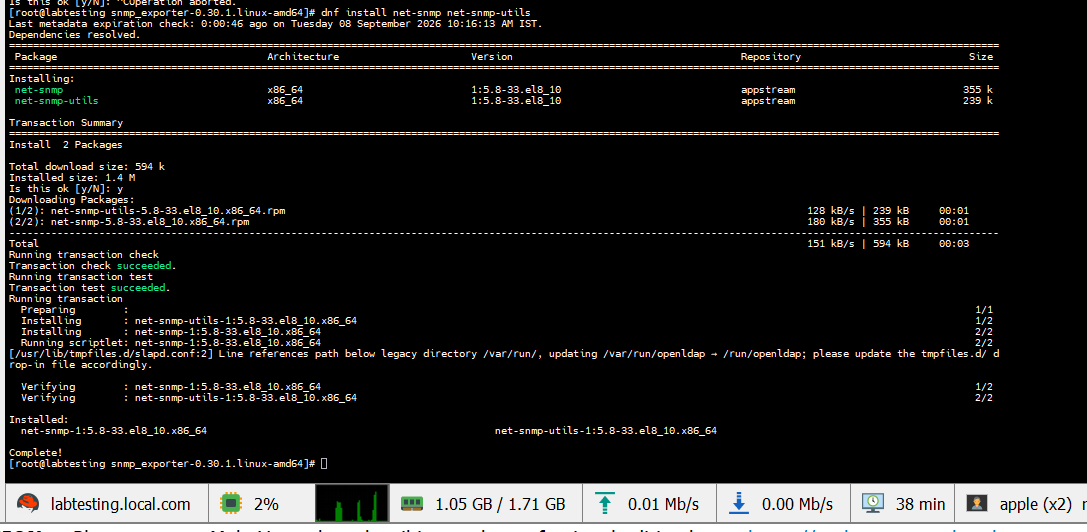
dnf install -y net-snmp net-snmp-utils
3.2 Configure the agent
cat > /etc/snmp/snmpd.conf << 'EOF'
rocommunity public 127.0.0.1
syslocation "Lab"
syscontact admin@labtesting.local.com
EOF
⚠️ Pitfall we hit: The IP after
rocommunity publicis a source restriction, not a target — it means only SNMP queries whose source address is127.0.0.1are answered. Querying the same host by its real IP (192.168.245.128) later caused a timeout, because the outgoing query's source address didn't match. Fix: changed this torocommunity public defaultto accept queries from any source (appropriate for a private lab subnet only, not internet-facing).

3.3 Enable and start the agent
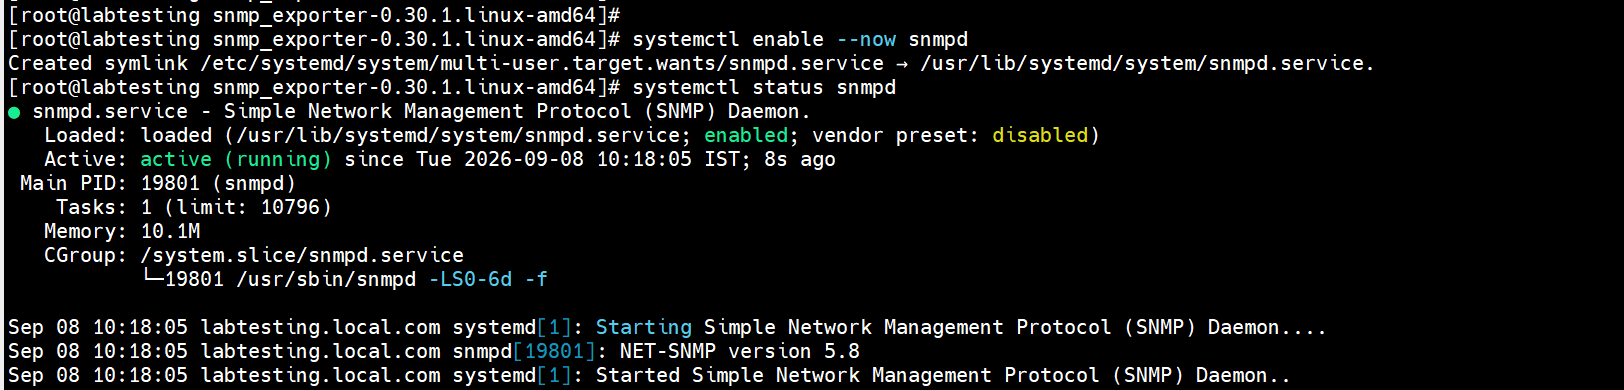
systemctl enable --now snmpd
Phase 4 — Verify the Full Local Chain
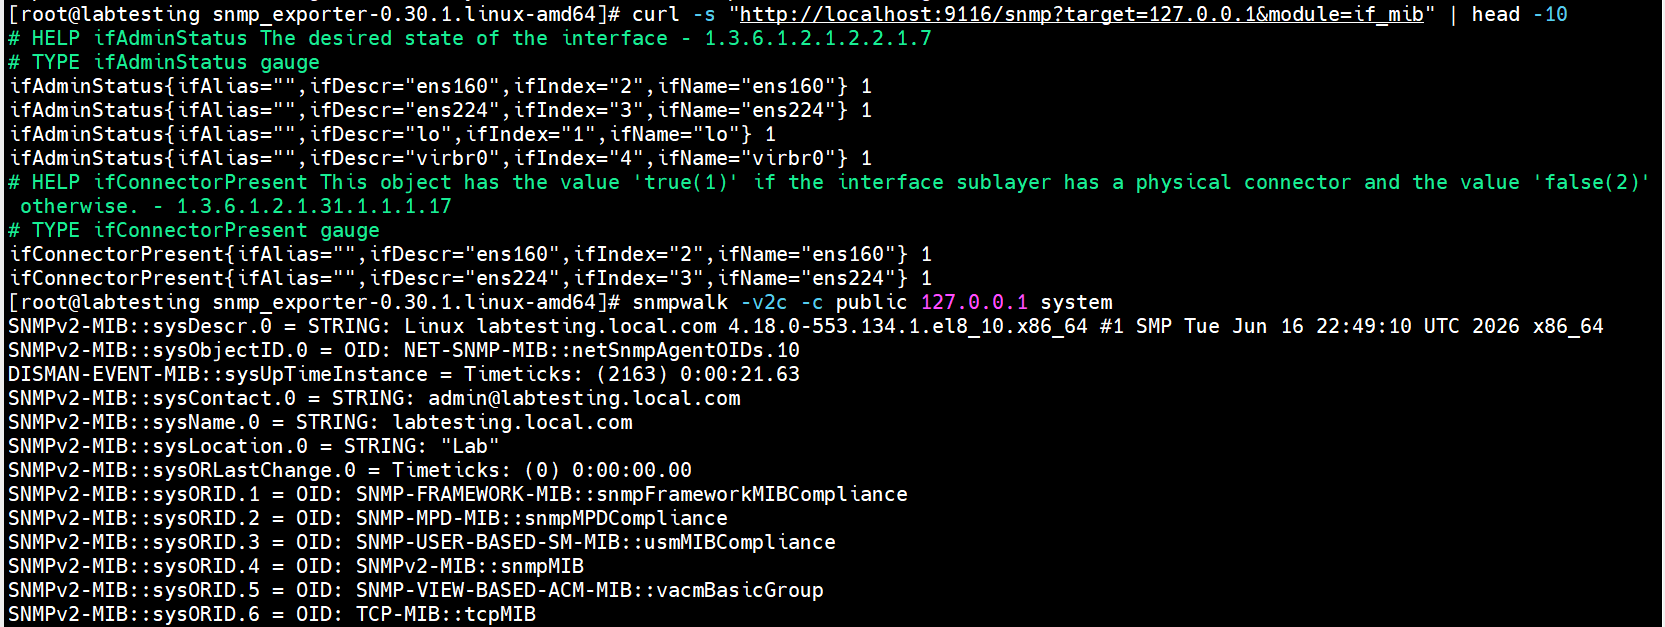
curl -s "http://localhost:9116/snmp?target=127.0.0.1&module=if_mib" | head -10
snmpwalk -v2c -c public 127.0.0.1 system
Why both commands: testing
snmp_exporter's own endpoint AND a directsnmpwalkboth confirm the two halves of the chain independently — the agent answering, and the exporter successfully querying and translating that answer into Prometheus format.
Phase 5 — Prometheus Scrape Configuration
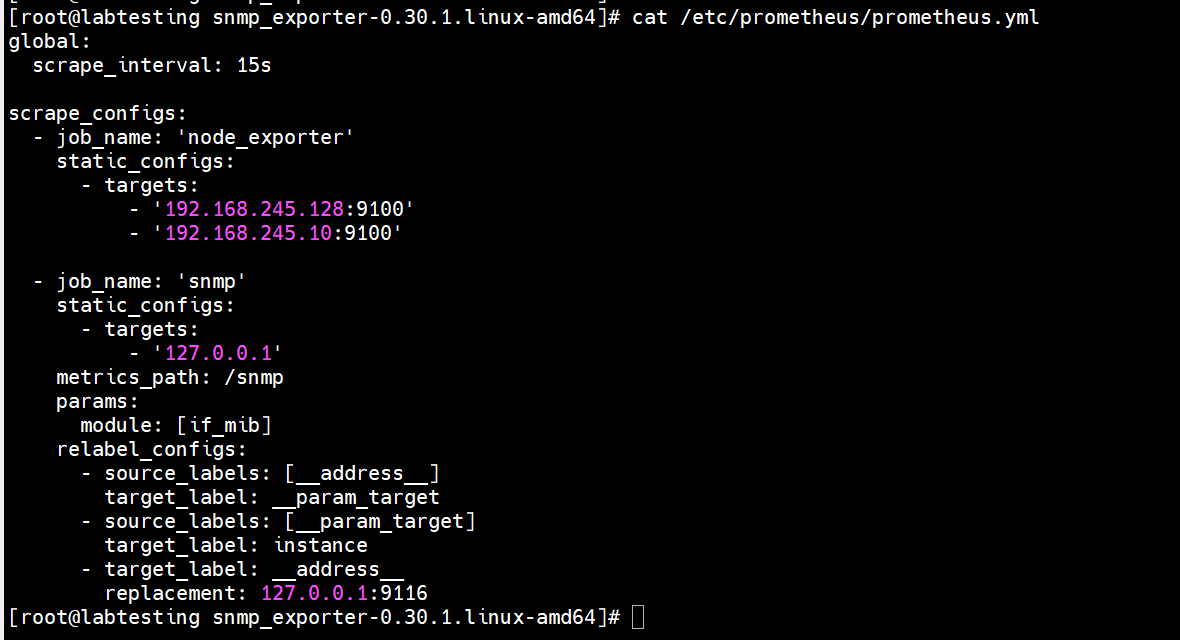
  - job_name: 'snmp'
    static_configs:
      - targets:
          - '127.0.0.1'   # later changed to 192.168.245.128, see Appendix
    metrics_path: /snmp
    params:
      module: [if_mib]
    relabel_configs:
      - source_labels: [__address__]
        target_label: __param_target
      - source_labels: [__param_target]
        target_label: instance
      - target_label: __address__
        replacement: 127.0.0.1:9116
Why: Prometheus doesn't scrape the monitored device directly — it scrapes
snmp_exporter, and relabeling passes the real device's address as a query parameter. This is why the address Prometheus connects to (snmp_exporter, port 9116) differs from the instance label shown on dashboards (the actual monitored device).
⚠️ Pitfall we hit: The systemd service originally used Prometheus 2.x-style flags (
--web.console.templates,--web.console.libraries) which reference directories Prometheus 3.x no longer ships. Also,--web.enable-lifecyclewas missing, socurl -X POST http://localhost:9090/-/reloadfailed withLifecycle API is not enabled.Fix: rewrote the service file to drop the console flags and add--web.enable-lifecycle, thensystemctl daemon-reload && systemctl restart prometheus.
Phase 6 — Grafana Dashboard
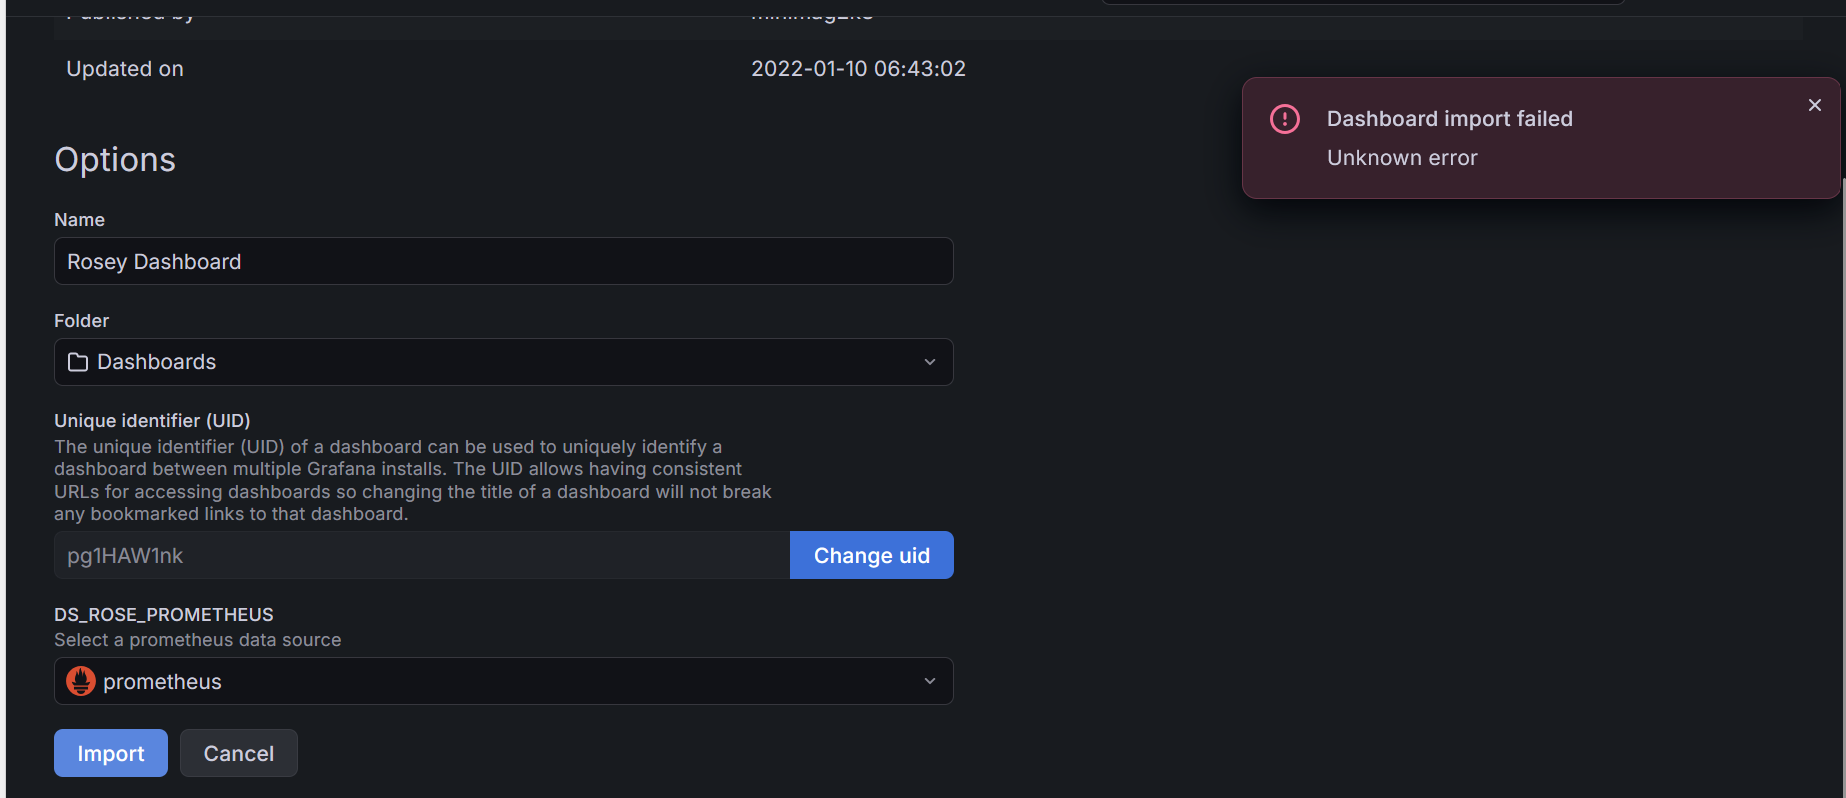
6.1 First attempt — dashboard ID 13649 failed
⚠️ Pitfall we hit: Dashboard ID
13649("Rosey Dashboard" — not actually SNMP-specific despite being suggested as one) failed to import with "Unknown error". Root cause: it's an old (2022) dashboard, almost certainly built on Angular-based panels, which Grafana removed support for in recent versions (this setup runs Grafana 13.2.0).
6.2 Working dashboard — ID 23022 ("SNMP Stats")
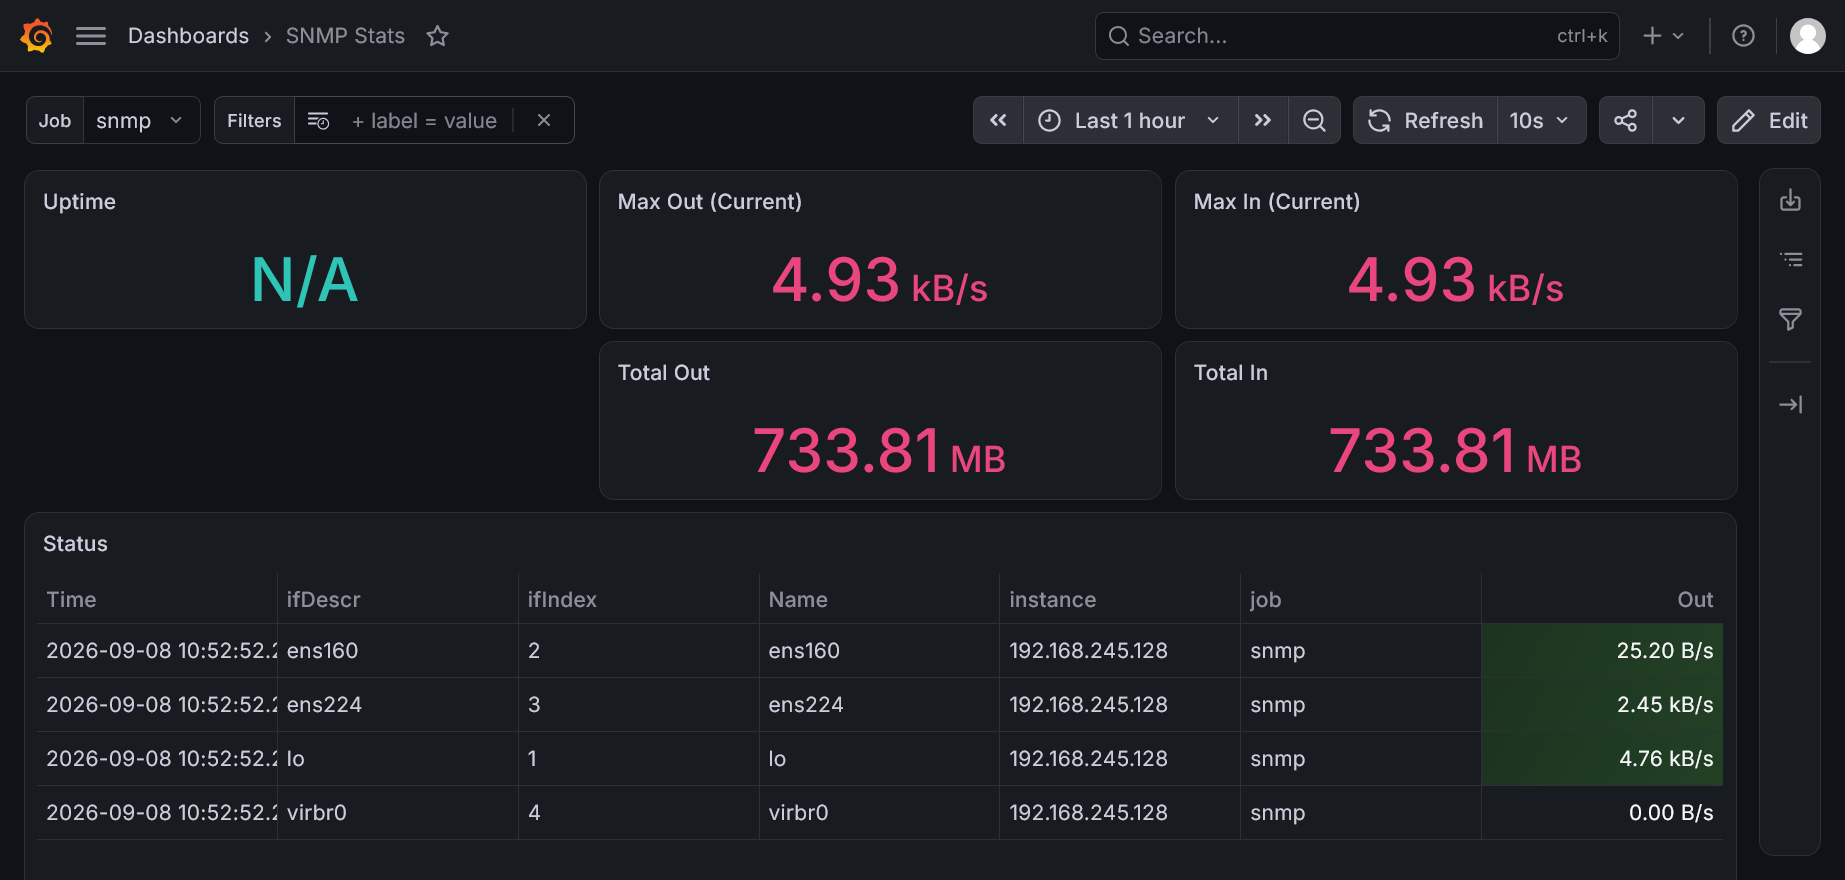
Dashboards → New → Import → enter 23022 → select the Prometheus data source → Import.
6.3 Fixing the "Uptime: N/A" panel
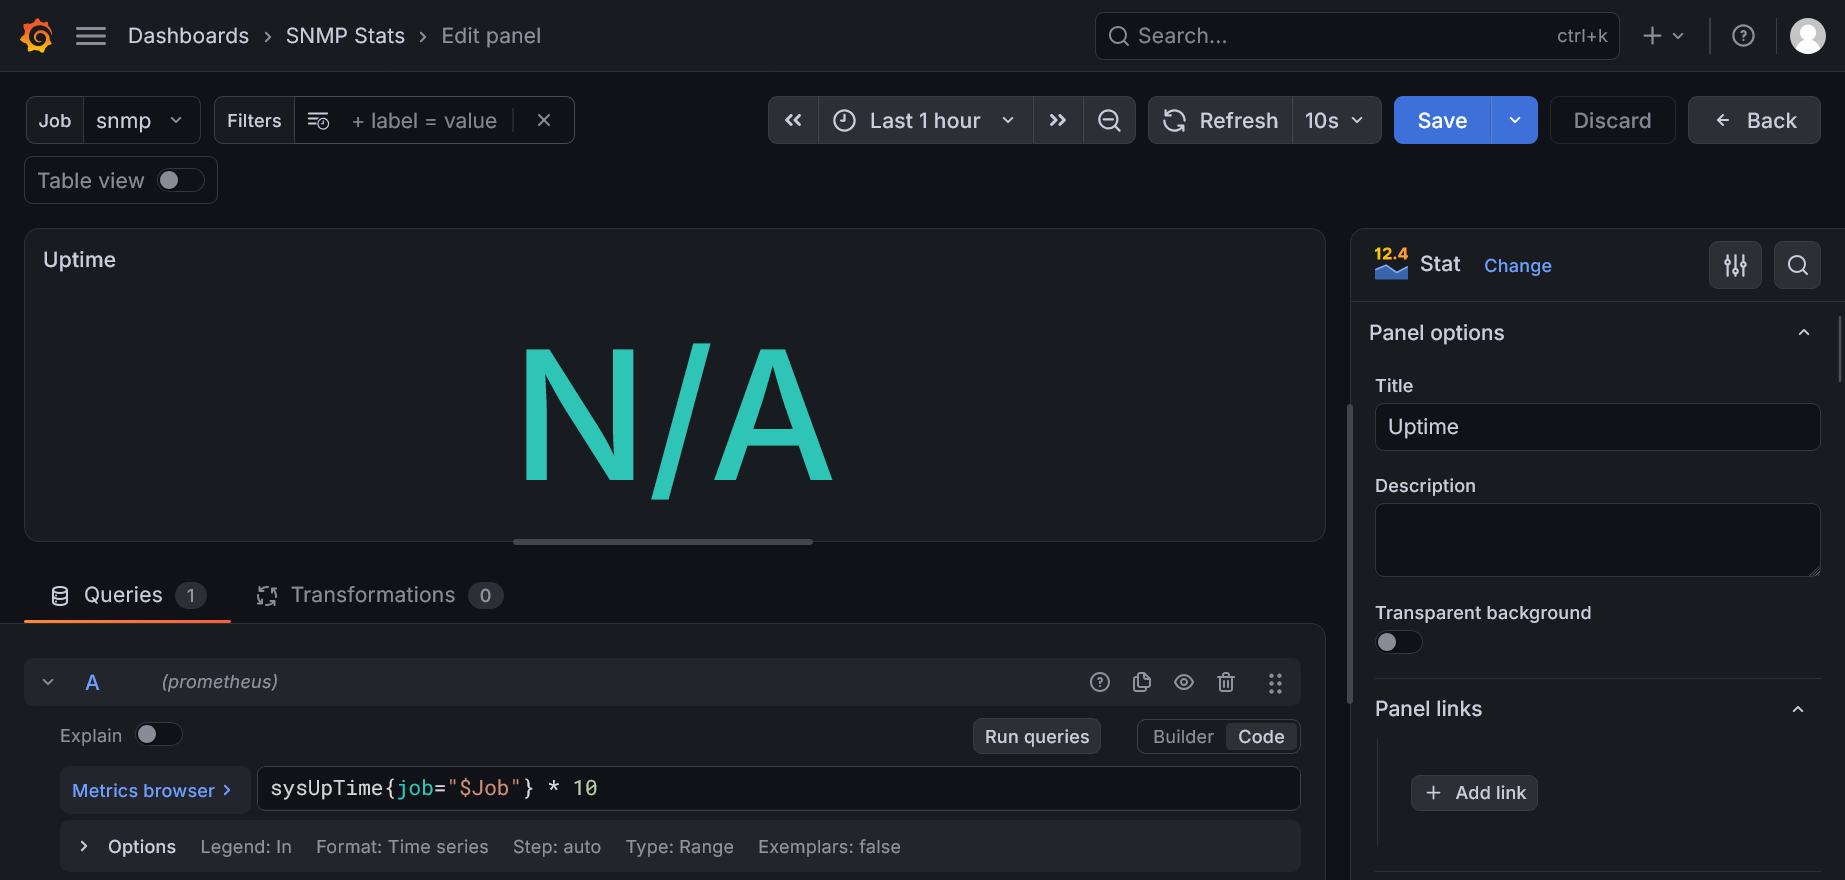
⚠️ Pitfall we hit: The dashboard's default Uptime panel queried
sysUpTime, which is not collected by theif_mibmodule (it only walks interface-related OIDs). Confirmed via:bash curl -s ".../snmp?...&module=if_mib" | grep -i uptimereturning nosysUpTimemetric. Fix: removed the panel rather than chasing an OID outside this module's scope.
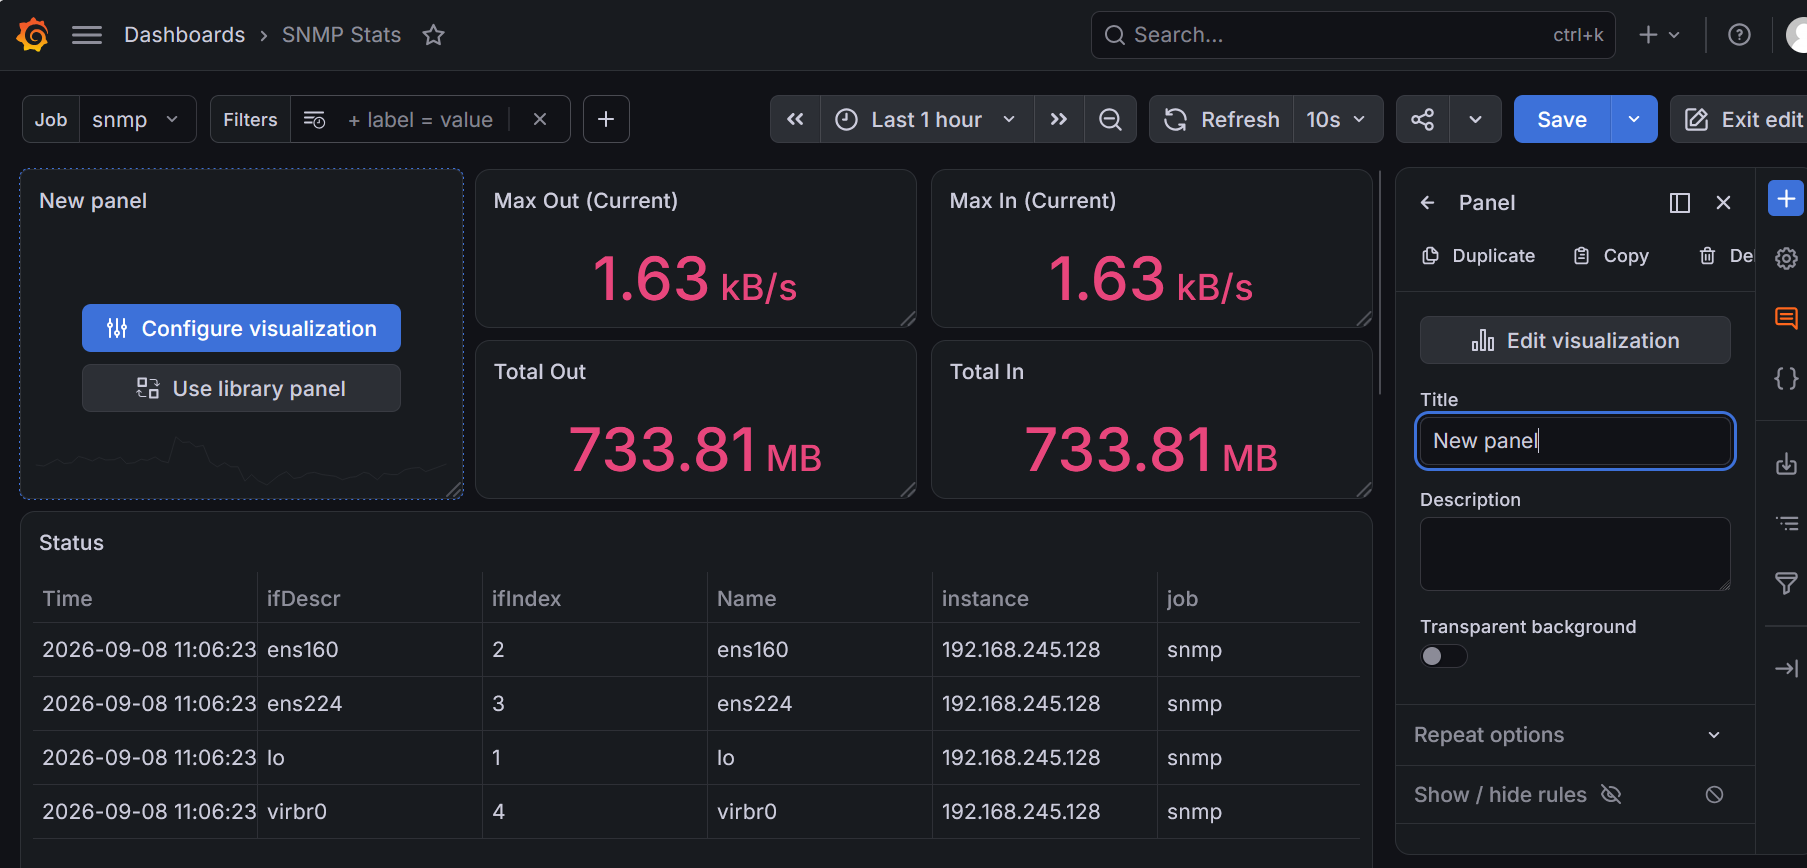
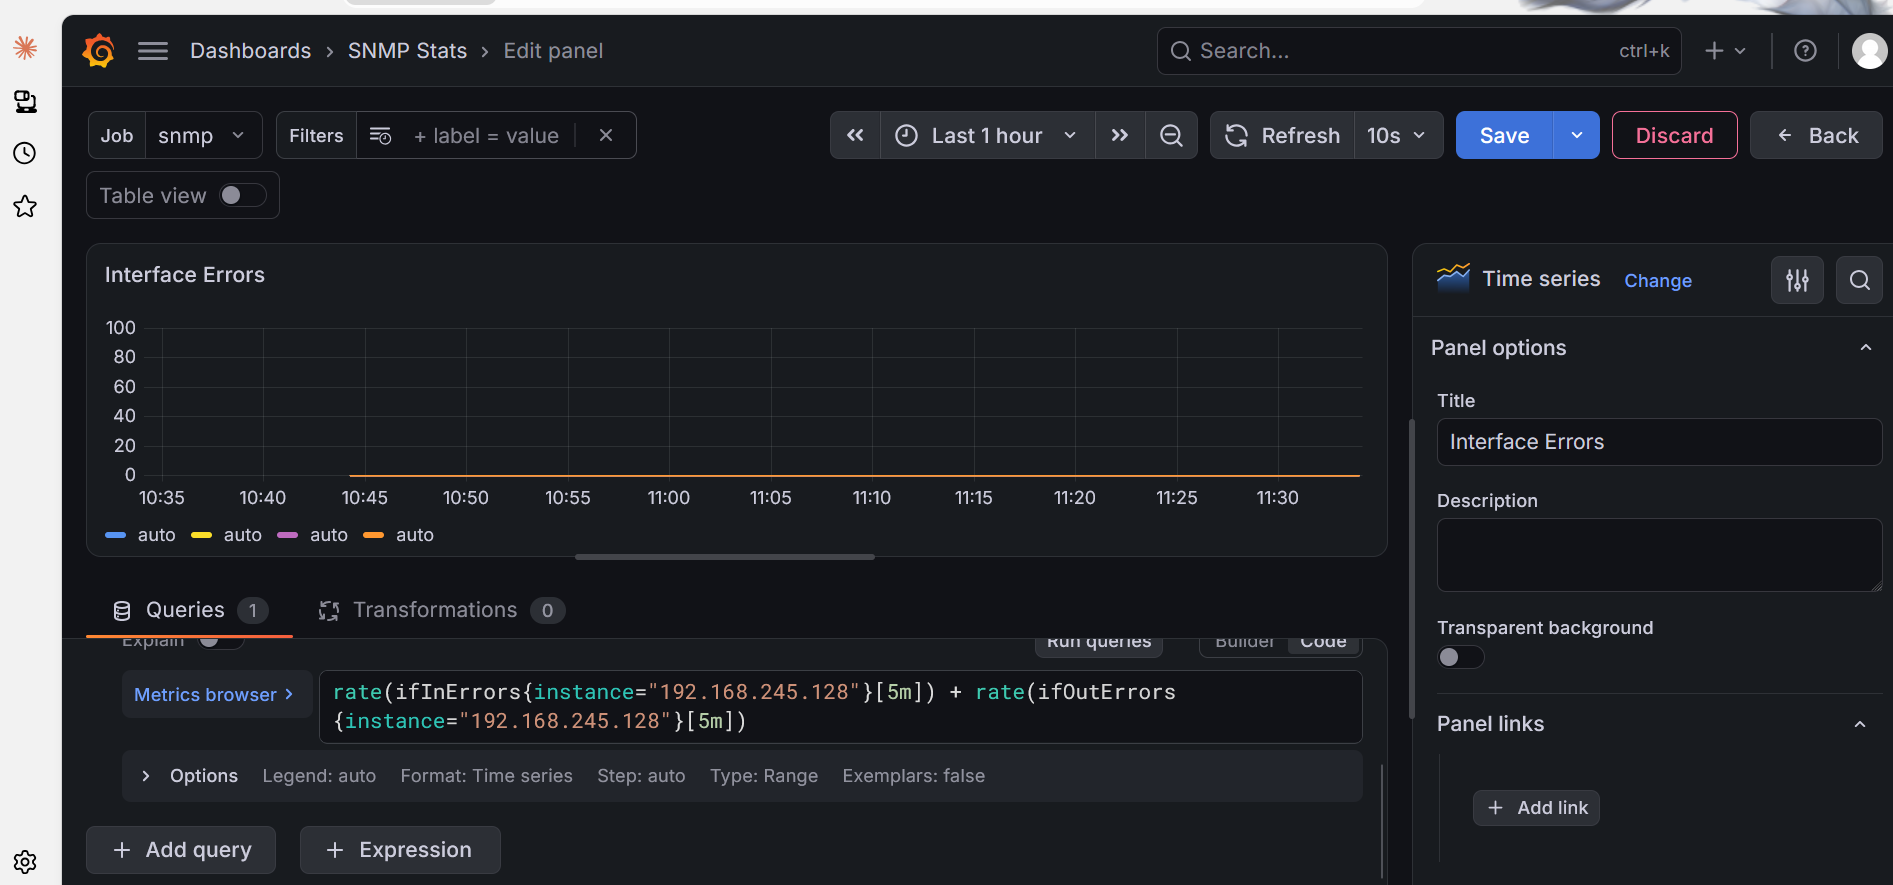
6.4 Adding a custom Interface Errors panel
Replaced the removed Uptime panel with a more useful one for a monitoring goal focused on the firewall/network — an errors-per-second panel:
rate(ifInErrors{instance="192.168.245.128"}[5m]) + rate(ifOutErrors{instance="192.168.245.128"}[5m])
6.5 Configuring the red/green threshold
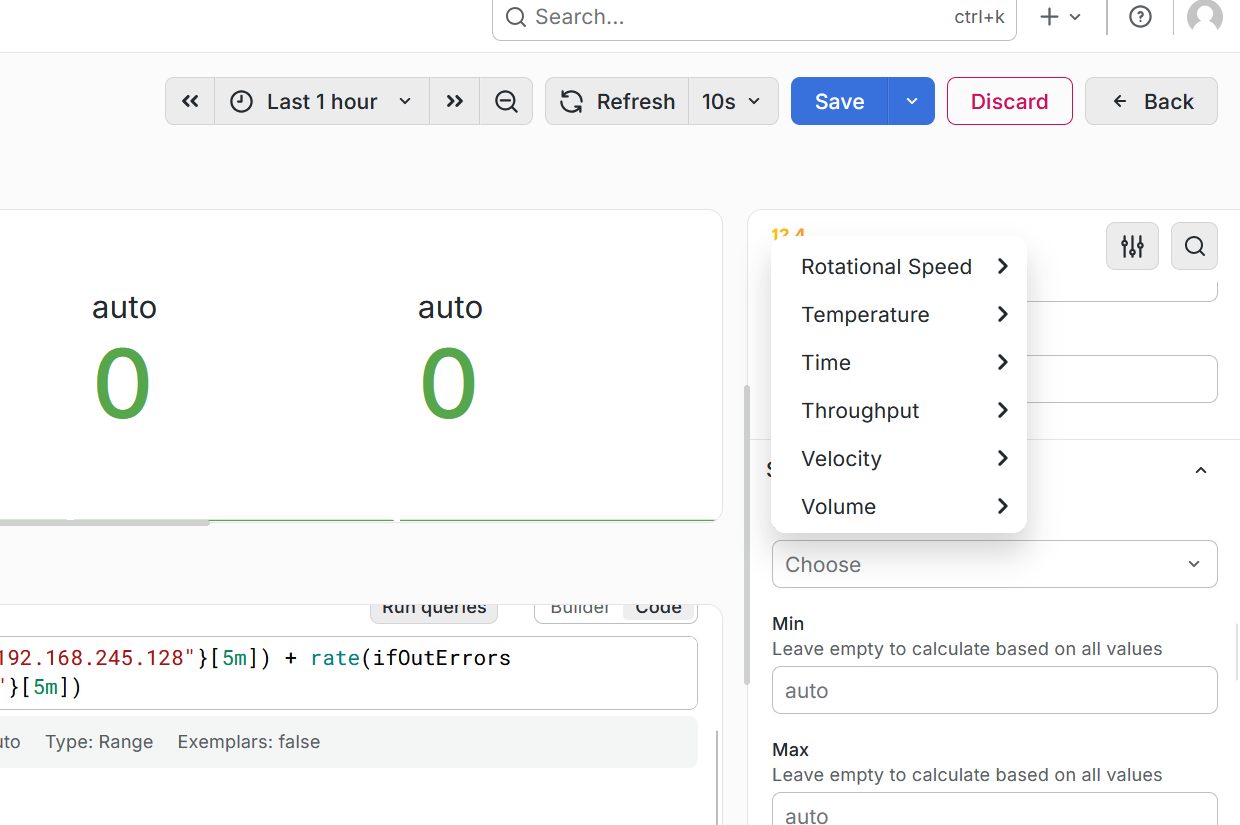
⚠️ Pitfall we hit: The Thresholds section is not inside the Unit picker — clicking near "Unit" opened an unrelated unit-category dropdown (Rotational Speed, Temperature, Time, etc.). The Thresholds section is its own separate collapsible block further down the Standard Options panel. Fastest way to find it: use the magnifying-glass search icon at the top of the options panel and type
thresholdto filter directly to it.
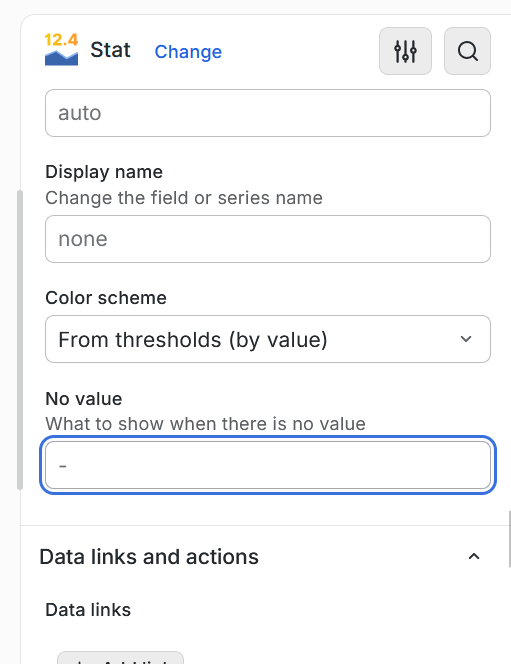
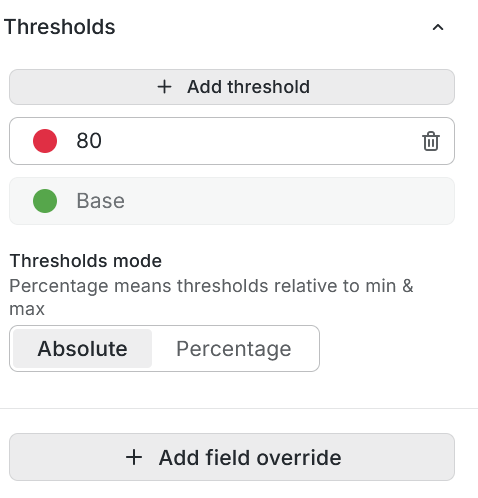
Why: a default threshold of
80makes no sense for an error-rate metric where any value above 0 indicates a real problem. Changed the red threshold to a small positive value (0.001) so exact0(healthy) stays green, and any real error rate immediately turns red.
6.6 Final result
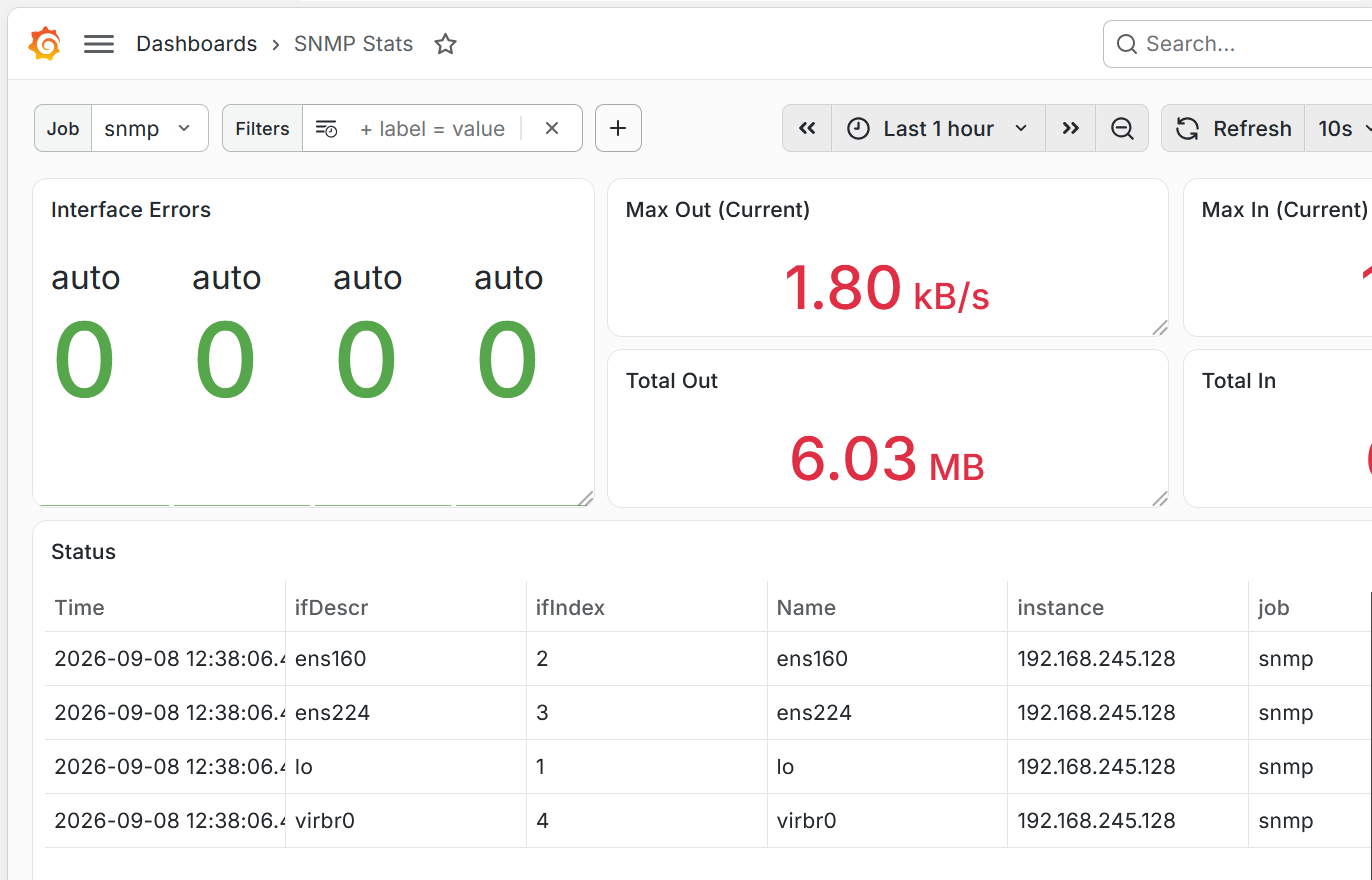
Verify: all four interfaces (ens160, ens224, lo, virbr0) show green 0 error panels alongside live traffic figures — the full SNMP monitoring chain is confirmed end-to-end.
Appendix A — Full Issue Log
| Symptom | Cause | Fix |
|---|---|---|
snmpwalk to 192.168.245.128 timed out after working on 127.0.0.1 |
rocommunity public 127.0.0.1 restricts allowed source address, not target |
sed -i 's/rocommunity public 127.0.0.1/rocommunity public default/' /etc/snmp/snmpd.conf && systemctl restart snmpd |
curl .../-/reload returned "Lifecycle API is not enabled" |
Prometheus systemd service was missing --web.enable-lifecycle |
Rewrote prometheus.service to add the flag (and drop obsolete --web.console.* flags); systemctl daemon-reload && systemctl restart prometheus |
Grafana dashboard 13649 import: "Unknown error" |
Old (2022) dashboard, not actually SNMP-specific by design, likely Angular-panel based — unsupported in Grafana 13.x | Used dashboard ID 23022 ("SNMP Stats") instead — modern panel types, imports cleanly |
| Uptime panel shows N/A | Panel queried sysUpTime, which the if_mib module does not collect |
Removed the panel; replaced with a metric actually covered by if_mib (interface errors) |
| Thresholds section not visible under Unit options | Thresholds is a separate collapsible section, not nested inside Standard/Unit options | Use the search icon in the panel options pane and type threshold to jump directly to it |
Default error threshold of 80 was meaningless for an error-rate metric |
Grafana's default Stat panel threshold (80) is a generic placeholder, not tailored to the metric | Changed the red threshold to 0.001 so exactly 0 stays green and any real error immediately shows red |
Appendix B — Screenshots Still Needed
The 20 screenshots above cover the full working path. These specific steps were done via terminal/pasted text rather than captured as /assets/xcat/snmp — grab these next time to make the guide fully screenshot-complete:
| Step | What to capture |
|---|---|
snmpd.conf fix |
Terminal showing the sed command changing rocommunity public 127.0.0.1 to rocommunity public default, plus the successful snmpwalk retest against the real IP (192.168.245.128) right after |
Corrected prometheus.service |
cat /etc/systemd/system/prometheus.service showing the final version without --web.console.templates/--web.console.libraries and with --web.enable-lifecycle |
| Lifecycle reload working | Terminal showing curl -X POST http://localhost:9090/-/reload returning silently (success) instead of the earlier "Lifecycle API is not enabled" error |
| Prometheus target health check | Browser or curl+jq output of http://localhost:9090/api/v1/targets showing the snmp job with "health": "up" and empty lastError, for the real target IP (not 127.0.0.1) |
| Grafana data source test | The Grafana Connections → Data sources → Prometheus screen showing the green "Data source is working" confirmation after Save & Test |
| Firewalld reverted | systemctl status firewalld showing inactive (dead) again, confirming the temporary troubleshooting change was undone and didn't stay enabled |